SexiGraf - Insights in your VMware Vpshere Environment with Grafana
- Edwin de Bruin
- 12 jan 2022
- 2 minuten om te lezen

Bijgewerkt op: 29 mei 2022
In my daily job insight in performance statistics of the VMware vSphere environment can make my job al lot easier. When going live with a newly build environment or especially when there is an issue with performance. Getting meassurements is key here so the discussion is about facts and not about assumptions. The effect of the changes you implement are shown (or not so you can continue the quest).
Of course there are solutions out there like vRops but licenses can be an issue or sometimes I just want to deploy something fast and just capture the data and give me some graphs.
A couple of years ago I started using Grafana for my Home Automation. I started to get really fond Grafana (just love how the you can correlate the data over time with multiple graphs from multiple sources)
When dealing with a performance issue I started my search if I could build a Grafana dashboard to give me some insight of the performance from vCenter like CPU ready, memory usage, vCPU pCPU ratio, vmotions etc.
I stumbled upon an preconfigured OVA called SexiGraf. This little sexy appliance is free to use and has so many dashboards available I could never build.
It's based upon Ubuntu and has all the necessary components preinstalled.

(picture from SexiGraf website. They still show Perl SDK here but are moving to PowerCLI, also built in )
Deployment is done within a couple of minutes. When done just login, configure the vCenter(s) and let the data collect!
Below are just some screenshots I took from my lab. There are a lot of dashboards available (below screenshot's gives an impression but more are available!)
Keep in mind tough, the appliance is deployed with a 16 GB vmdk. When collecting data over a longer period of time the disk could fill up... espessialy when there are a lot of VM's in play like with Horizon VDI or Xendesktop

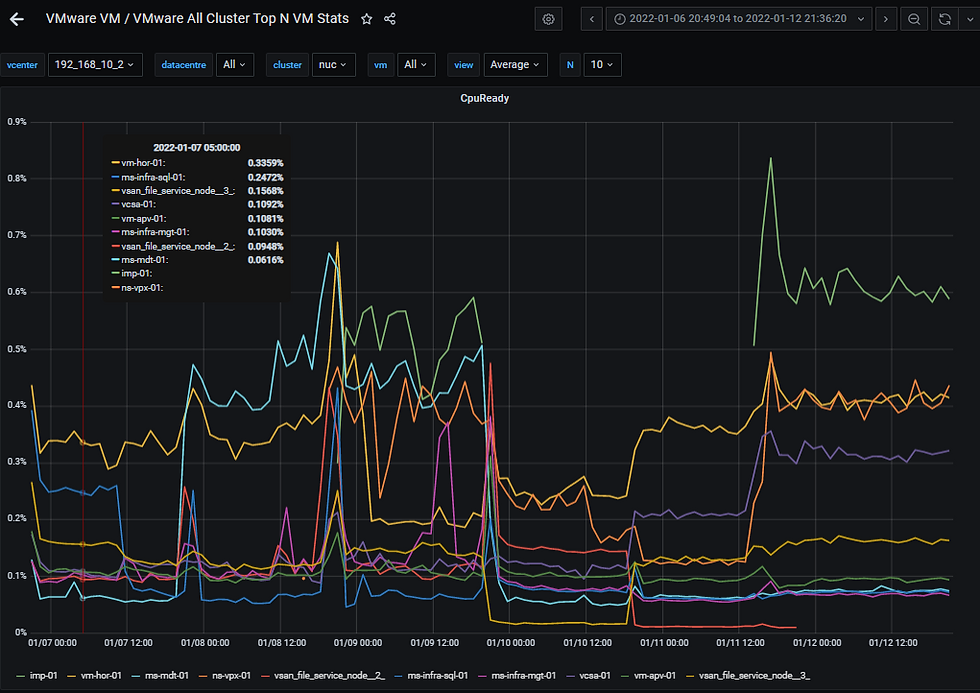


Of course the interpretation of the graphs and data has to be done by you.. but hey thats what we're paid for ;-)
For download, install instructions and explanations of all the dashboards:
https://www.sexigraf.fr


Opmerkingen